Map report now shows trial activity and conversion

GrowPanel's world map has always been one of my favorite reports. There's something immediately clarifying about seeing your business painted across a globe – which countries drive your MRR, where your subscribers cluster, how ARPA and churn vary by geography.
Today, we're adding two new views to the map: New trials and Trial conversion.
See where your pipeline comes from
The "New trials" tab shows you how many trial signups originated from each country during your selected date range. The map colors by volume, so you can instantly spot your hottest markets for new interest.
The accompanying table shows:
- Trial count per country
- How many converted to paid
- Conversion rate
- Current MRR and subscriber count from that country
This gives you a complete picture: not just where your customers are, but where your future customers are coming from.
Conversion rate by geography
The "Trial conversion" tab flips the focus. Instead of coloring by volume, it colors by conversion rate – showing you which countries convert trials into paying customers most effectively.
This is where things get interesting.
You might discover that a small market with modest trial volume actually converts at 40%, while your largest market converts at 15%. That's a signal. Maybe your product resonates better with certain use cases common in that region. Maybe your pricing hits a sweet spot there. Maybe your competitors are weaker.
Whatever the reason, now you can see it.
Why geography matters for trials
Most SaaS founders track trial metrics in aggregate: total trials, overall conversion rate, days to convert. That's useful, but it hides a lot.
Geographic breakdown reveals patterns that aggregate numbers obscure:
- Product-market fit varies by region. Your messaging might resonate strongly in the US but fall flat in Europe.
- Pricing perception differs. $49/month feels different in San Francisco than in São Paulo.
- Competition varies. You might be the obvious choice in one market and unknown in another.
- Support and onboarding matter. Time zones, language, and local expectations all affect whether a trial converts.
With trial data on the map, you can start asking sharper questions: "Why is Germany sending us trials but not converting?" or "Should we double down on the UK where conversion is exceptional?"
How it works
The new map tabs appear alongside the existing views (MRR, Subscribers, ARPA, Churn, LTV). Just click "New trials" or "Trial conversion" to switch perspectives.
Date range filters apply as you'd expect – so you can look at trial activity for the last quarter, the last year, or any custom period.
The data comes from your trial start dates, and conversion is measured by whether the customer eventually became a paying subscriber (regardless of when that happened relative to the selected date range).
Part of a bigger picture
This update is part of our ongoing work to make GrowPanel the most complete view of your SaaS business. Trials have always been visible in the dedicated Leads and Trials reports, but surfacing them on the map adds geographic context that's hard to get any other way.
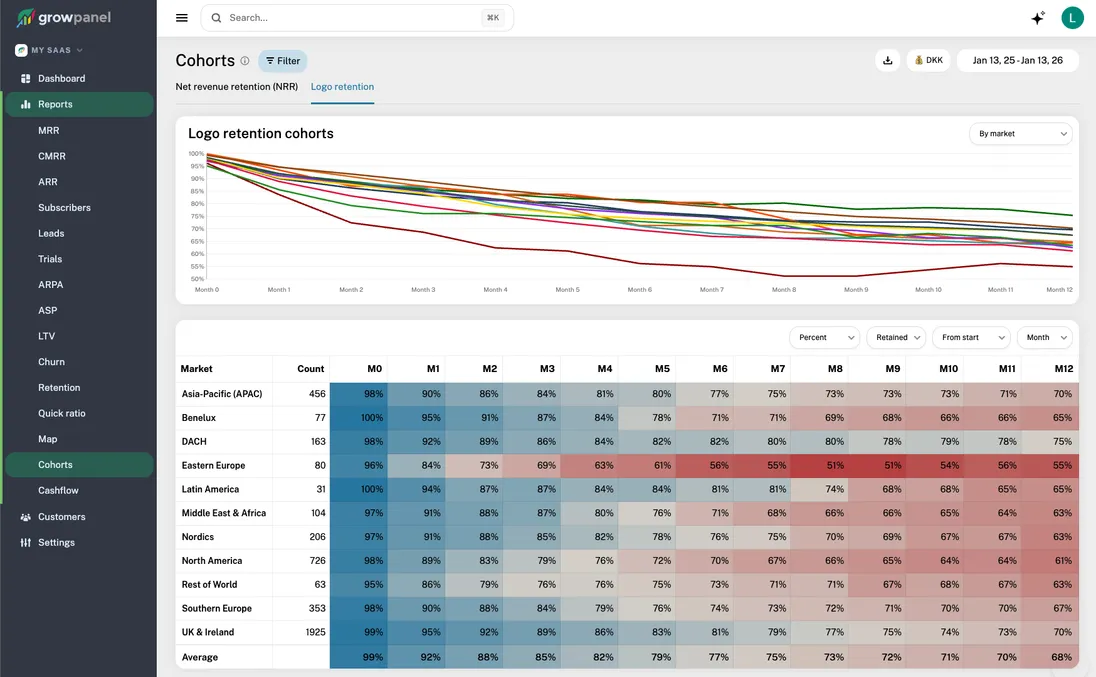
Combined with yesterday's cohort breakdown update, you now have much more flexibility in how you slice your data – whether you're analyzing retention by currency or trial conversion by country.
Feedback welcome
As always, I'd love to hear how you're using these new views. If you spot patterns in your data that surprise you, or if there's a dimension you wish we supported, drop me a line.
Here's to knowing your business better.

Founder & CEO
Lasse is the founder of GrowPanel. He previously founded Mouseflow, scaling it from $0 to $10M ARR before exiting. He also co-founded Soundvenue and actively invests in SaaS startups.
View full profile →